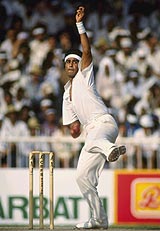
Of the many complexities that constitute the game, perhaps none is more abstruse than the lbw law. There are myriad calculations that the umpire needs to make: first, he needs to check where the ball pitched; then, whether it hit the batsman in line with the stumps or not; if there was an inside edge involved; if the height was ok; and finally, if the ball was going on to hit the stumps. All these decisions need to be made in a few seconds, at real-time speed, without any aid from television replays.
It isn't surprising, then, that in the early days, umpires were loathe to rule in favour of the bowlers: of the 2143 dismissals between 1877 and 1899, only 101 were lbws, a measly 4.71%. Gradually, over the decades, that figure has been going up (see table below), possibly due to a variety of reasons: perhaps the advent of better protective gear has helped batsmen get in line with the ball - and the stumps - more regularly, so that ball is hitting the pad more often; or the mindset of the umpires has undergone a change, with more marginal calls going in favour of the bowler than was the case earlier. There could be various explanations, but the facts are quite stark: since 1960, the number of lbws as a percentage of total dismissals has gone up by a staggering 50%.
The advent of technology has made the umpires' job an even more arduous one, with Hawk-Eye's ball-tracking technology offering the arm-chair critic plenty of ammunition to use against the officials. On the other hand, it has also brought to light some of the common errors umpires tend to make when adjudicating on lbws - for example, deliveries going over the top of the stumps often fetch bowlers wickets. On the other hand, bowlers are often denied legitimate appeals on the premise that the ball might have slid down leg side. The technology, though, has also provided the umpires an opportunity to study their decision-making, and correct common misconceptions. It's debatable if training by technology has played a part, but umpires have certainly been more trigger-happy in the 2000s.
Historically, right-handed batsmen have fallen victim to this mode of dismissal more often than the left-handers. That seems fair enough too, since there are far more right-arm bowlers around, and many of them prefer bowling from over the wicket, which'd suggest that many of their deliveries would pitch outside leg, ruling out the lbw. However, it's interesting to note that the gap is gradually reducing: in the 1980s, lbws constituted 16.11% of right-handers' dismissals, and 12.87 of left-handers'; the difference of 3.23 percentage points dropped to 2.27 in the 1990s, and to 1.85 in the 2000s.
And now for a quiz question: which team got the highest percentage of lbw decisions (as a ratio of total wickets taken) in the 2000s? If your guess is Australia - based, perhaps, on all the recent controversy of their last two home series - then you're wrong. Sri Lanka, with one in every five dismissals being lbws, are on top of the heap, and Australia only come in at fourth place, behind India and Pakistan as well. In the 1990s and 1980s, though, the team that dominated the charts was Pakistan: in the 90s, their lbw percentage was an incredible 23.30%, almost five percentage points ahead of second-placed India; in the 80s, that figure was 19.42%.
Team-wise lbws in the 2000s
| Team |
LBWs |
Total dismissals made |
LBW % |
| Sri Lanka |
204 |
1010 |
20.20 |
| India |
181 |
941 |
19.23 |
| Pakistan |
160 |
871 |
18.37 |
| Australia |
255 |
1393 |
18.31 |
| England |
220 |
1234 |
17.83 |
| Bangladesh |
60 |
373 |
16.09 |
| Zimbabwe |
84 |
525 |
16.00 |
| West Indies |
164 |
1063 |
15.43 |
| New Zealand |
99 |
691 |
14.33 |
| South Africa |
149 |
1120 |
13.30 |
It's hardly surprising, though, that the lbw was such a dominant mode of dismissal for Pakistan: Waqar Younis and Wasim Akram, the two who dominated their attack during that period, top the all-time list of bowlers with the highest lbw percentage (among bowlers with at least 250 Test wickets).
