Rich half, poor half
Batsmen with the largest differences in average between the two halves of their careers in Tests and ODIs
Travis Basevi and George Binoy
22-Sep-2010
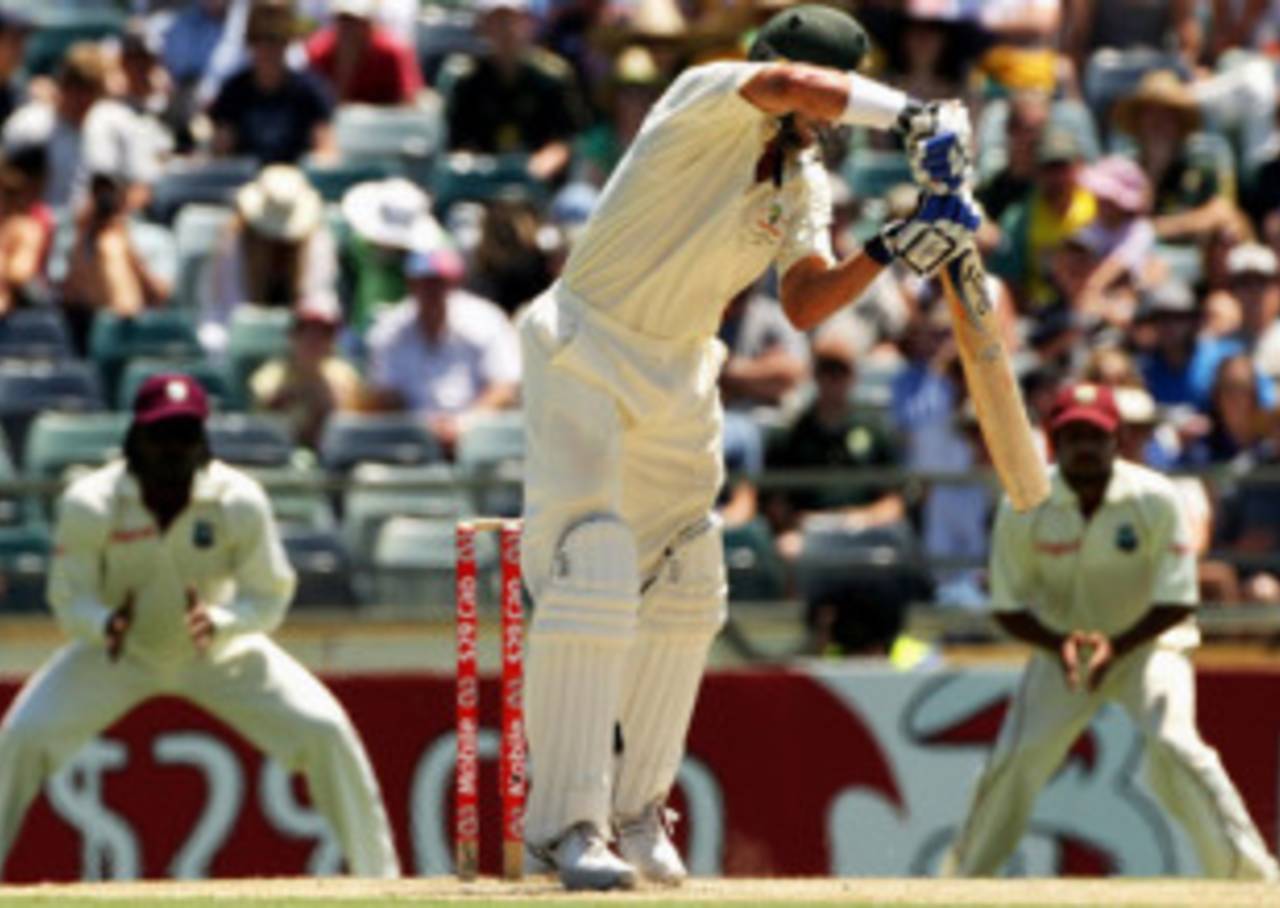
Michael Hussey's Test average had assumed normal proportions after a terrific start • Getty Images
Michael Hussey's maiden Test hundred, against West Indies in Hobart, was memorable. It was in his second Test, back in November 2005, and his emotional celebration captured the delight of a man who'd toiled for years on the domestic circuit to experience this moment. That match was also my first ball-by-ball commentary stint and thereafter I began to follow Hussey's career closely, to see how long he could sustain his towering average. It reached the dizzy heights of 120 and stayed in the mid-80s for the best part of his first two years on the international circuit. His average at present, however, is only 51.03, the lowest it's ever been since that maiden hundred. The decline is due to Hussey's ordinary performance in the second half of his Test career, compared to his superhuman effort in the first.
Hussey has played 52 Tests to date, and after his 26th, he had 2502 runs, nine hundreds and an average of 69.50. It was in his 26th match - against India at the WACA in January 2008 - that Hussey's mean slipped out of the 70s for good. In the 26 Tests since then, he's scored only 1479 runs at 35.21. The difference of 34.29 between the averages in the first and second halves of Hussey's career is the second highest in our table below. The Australians are in India at the moment, and a poor Test series could push Hussey's average closer to the 50 benchmark.
Most of the players with large differences between averages in the first and second halves haven't had extremely long Test careers. In fact, two members of two marvellous Australian sides, Neil Harvey and Adam Gilchrist, are the only ones with more than 60 matches and a significantly greater average in the first half of their careers than in their second. Gilchrist averaged 59 in his first 48 Tests and only 38.41 in his next 48, which is odd considering he made nearly the same number of centuries in each half - nine in the first and eight in the second.
| Player | Span | Mat | Ave | Mat | Inns | Runs | Ave | 100 | Mat | Inns | Runs | Ave | 100 | Diff | |||
|---|---|---|---|---|---|---|---|---|---|---|---|---|---|---|---|---|---|
| JC Adams (WI) | 1992-2001 | 54 | 41.26 | 27 | 43 | 1963 | 61.34 | 5 | 27 | 47 | 1049 | 25.58 | 1 | 35.76 | |||
| MEK Hussey (Aus) | 2005-2010 | 52 | 51.03 | 26 | 44 | 2502 | 69.50 | 9 | 26 | 46 | 1479 | 35.21 | 2 | 34.29 | |||
| 22 | 1293 | 61.57 | 6 | 15 | 27 | 754 | 29.00 | 1 | 32.57 | ||||||||
| BC Booth (Aus) | 1961-1966 | 29 | 42.21 | 15 | 27 | 1197 | 57.00 | 4 | 14 | 21 | 576 | 27.42 | 1 | 29.57 | |||
| AR Morris (Aus) | 1946-1955 | 46 | 46.48 | 23 | 37 | 2097 | 61.67 | 10 | 23 | 42 | 1436 | 34.19 | 2 | 27.49 | |||
| RN Harvey (Aus) | 1948-1963 | 79 | 48.41 | 40 | 69 | 3833 | 60.84 | 15 | 39 | 68 | 2316 | 36.18 | 6 | 24.65 | |||
| VS Hazare (India) | 1946-1953 | 30 | 47.65 | 15 | 28 | 1420 | 59.16 | 6 | 15 | 24 | 772 | 35.09 | 1 | 24.08 | |||
| MJ Greatbatch (NZ) | 1988-1996 | 41 | 30.62 | 21 | 35 | 1291 | 43.03 | 2 | 20 | 36 | 730 | 20.27 | 1 | 22.76 | |||
| 37 | 1630 | 46.57 | 4 | 20 | 37 | 949 | 25.64 | 1 | 20.92 | ||||||||
| MJ Horne (NZ) | 1997-2003 | 35 | 28.38 | 18 | 34 | 1262 | 38.24 | 3 | 17 | 31 | 526 | 17.53 | 1 | 20.71 | |||
| AC Gilchrist (Aus) | 1999-2008 | 96 | 47.60 | 48 | 65 | 3073 | 59.09 | 9 | 48 | 72 | 2497 | 38.41 | 8 | 20.68 | |||
| BW Luckhurst (Eng) | 1970-1974 | 21 | 36.05 | 11 | 21 | 796 | 46.82 | 3 | 10 | 20 | 502 | 26.42 | 1 | 20.40 | |||
| RB McCosker (Aus) | 1975-1980 | 25 | 39.56 | 13 | 24 | 1000 | 50.00 | 3 | 12 | 22 | 622 | 29.61 | 1 | 20.38 | |||
| MS Sinclair (NZ) | 1999-2010 | 33 | 32.05 | 17 | 29 | 1060 | 42.40 | 3 | 16 | 27 | 575 | 22.11 | 0 | 20.28 | |||
| 36 | 1703 | 54.93 | 5 | 19 | 38 | 1219 | 34.82 | 2 | 20.11 | ||||||||
| Javed Burki (Pak) | 1960-1969 | 25 | 30.47 | 13 | 25 | 917 | 39.86 | 3 | 12 | 23 | 424 | 20.19 | 0 | 19.68 | |||
| WR Endean (SA) | 1951-1958 | 28 | 33.95 | 14 | 25 | 979 | 44.50 | 2 | 14 | 27 | 651 | 25.03 | 1 | 19.46 | |||
| ED Solkar (India) | 1969-1977 | 27 | 25.42 | 14 | 23 | 678 | 35.68 | 0 | 13 | 25 | 390 | 16.95 | 1 | 18.73 | |||
| PH Parfitt (Eng) | 1961-1972 | 37 | 40.91 | 19 | 25 | 1113 | 50.59 | 6 | 18 | 27 | 769 | 32.04 | 1 | 18.55 | |||
| S Wettimuny (SL) | 1982-1987 | 23 | 29.07 | 12 | 23 | 832 | 37.81 | 2 | 11 | 20 | 389 | 19.45 | 0 | 18.37 |
And then there are those who picked up speed in the second half of their careers, after a relatively slow first half. Gautam Gambhir had one century against Bangladesh, 904 runs and an average of 36 after his first 16 Tests. Australia were about to tour India in October 2008, and Gambhir's fallow run was about to end. He was the top run-scorer in that series despite being banned for one Test, making 463 with a double-century and a hundred. Gambhir scored eight centuries during a period of 10 Tests and has accumulated 1896 runs at 67.71 in his last 16 matches.
Since Don Bradman finished with an average of 99.94, you'd imagine that he was relatively consistent over his 52-Test career and therefore wouldn't appear in our tables. But no. Bradman upped his game in the second half of his career to get to where he did. In his first 26 Tests he averaged 89.55, scoring 3224 runs with 13 tons. In the second half of his career, however, he averaged 110.94, making 3772 runs with 16 hundreds.
| Player | Span | Mat | Ave | Mat | Inns | Runs | Ave | 100 | Mat | Inns | Runs | Ave | 100 | Diff | |||
|---|---|---|---|---|---|---|---|---|---|---|---|---|---|---|---|---|---|
| CG Macartney (Aus) | 1907-1926 | 35 | 41.78 | 18 | 31 | 811 | 27.03 | 1 | 17 | 24 | 1320 | 62.85 | 6 | 35.82 | |||
| G Gambhir (India) | 2004-2010 | 32 | 52.83 | 16 | 27 | 904 | 36.16 | 1 | 16 | 30 | 1896 | 67.71 | 8 | 31.55 | |||
| AB de Villiers (SA) | 2004-2010 | 61 | 45.50 | 31 | 57 | 1921 | 35.57 | 3 | 30 | 48 | 2311 | 59.25 | 7 | 23.68 | |||
| 69 | 1651 | 27.98 | 1 | 44 | 57 | 2156 | 51.33 | 5 | 23.35 | ||||||||
| JW Burke (Aus) | 1951-1959 | 24 | 34.59 | 12 | 23 | 519 | 24.71 | 1 | 12 | 21 | 761 | 47.56 | 2 | 22.85 | |||
| CL Walcott (WI) | 1948-1960 | 44 | 56.68 | 22 | 34 | 1434 | 44.81 | 5 | 22 | 40 | 2364 | 67.54 | 10 | 22.73 | |||
| EAB Rowan (SA) | 1935-1951 | 26 | 43.66 | 13 | 25 | 750 | 32.60 | 0 | 13 | 25 | 1215 | 55.22 | 3 | 22.62 | |||
| Younis Khan (Pak) | 2000-2009 | 63 | 50.09 | 32 | 55 | 2077 | 39.18 | 6 | 31 | 57 | 3183 | 61.21 | 10 | 22.02 | |||
| SJ McCabe (Aus) | 1930-1938 | 39 | 48.21 | 20 | 29 | 992 | 36.74 | 1 | 19 | 33 | 1756 | 58.53 | 5 | 21.79 | |||
| 39 | 3224 | 89.55 | 13 | 26 | 41 | 3772 | 110.94 | 16 | 21.39 | ||||||||
| RG Pollock (SA) | 1963-1970 | 23 | 60.97 | 12 | 21 | 972 | 51.15 | 3 | 11 | 20 | 1284 | 71.33 | 4 | 20.18 | |||
| DL Vettori (ICC/NZ) | 1997-2010 | 100 | 30.71 | 50 | 73 | 1249 | 20.47 | 1 | 50 | 79 | 2713 | 39.89 | 4 | 19.42 | |||
| A Flower (Zim) | 1992-2002 | 63 | 51.54 | 32 | 57 | 2030 | 42.29 | 5 | 31 | 55 | 2764 | 61.42 | 7 | 19.13 | |||
| MH Denness (Eng) | 1969-1975 | 28 | 39.69 | 14 | 24 | 718 | 31.21 | 0 | 14 | 21 | 949 | 49.94 | 4 | 18.73 | |||
| T Taibu (Zim) | 2001-2005 | 24 | 29.60 | 12 | 24 | 482 | 20.95 | 0 | 12 | 22 | 791 | 39.55 | 1 | 18.59 | |||
| 23 | 409 | 18.59 | 0 | 11 | 22 | 731 | 36.55 | 1 | 17.96 | ||||||||
| JE Cheetham (SA) | 1949-1955 | 24 | 23.86 | 12 | 23 | 394 | 17.13 | 0 | 12 | 20 | 489 | 34.92 | 0 | 17.80 | |||
| KC Sangakkara (SL) | 2000-2010 | 91 | 56.85 | 46 | 76 | 3466 | 48.13 | 7 | 45 | 76 | 4550 | 65.94 | 16 | 17.80 | |||
| KR Rutherford (NZ) | 1985-1995 | 56 | 27.08 | 28 | 45 | 763 | 18.16 | 1 | 28 | 54 | 1702 | 34.73 | 2 | 16.57 | |||
| JE Emburey (Eng) | 1978-1995 | 64 | 22.53 | 32 | 47 | 520 | 14.05 | 0 | 32 | 49 | 1193 | 30.58 | 0 | 16.54 |
Kevin Pietersen had a fabulous start to his ODI career and averaged more than 100 after his first 17 games. His mean began to decline steadily thereafter, understandably, given the limited opportunities of limited-overs cricket, and after 52 matches Pietersen's average was 55.64. His form has continued to worsen, though, and he has scored only 1273 runs and two centuries in the second half of his career at an average of 30.30. His overall career mean at the moment is 42.17 and he was axed for England's ongoing limited-overs series against Pakistan. The difference of 25.34 between Pietersen's average in the first and second halves of his career is the second highest in ODIs, after Glenn Turner.
| Player | Span | Mat | Ave | Mat | Inns | Runs | Ave | 100 | Mat | Inns | Runs | Ave | 100 | Diff | |||
|---|---|---|---|---|---|---|---|---|---|---|---|---|---|---|---|---|---|
| 20 | 886 | 63.28 | 2 | 20 | 20 | 712 | 35.60 | 1 | 27.69 | ||||||||
| KP Pietersen (Eng/ICC) | 2004-2010 | 104 | 42.17 | 52 | 46 | 2059 | 55.64 | 5 | 52 | 48 | 1273 | 30.30 | 2 | 25.34 | |||
| MA Atherton (Eng) | 1990-1998 | 54 | 35.11 | 27 | 27 | 1188 | 47.52 | 1 | 27 | 27 | 603 | 23.19 | 1 | 24.33 | |||
| RL Dias (SL) | 1979-1987 | 58 | 31.46 | 29 | 27 | 1058 | 44.08 | 2 | 29 | 28 | 515 | 19.80 | 0 | 24.28 | |||
| HJH Marshall (NZ) | 2003-2007 | 66 | 27.43 | 33 | 31 | 980 | 39.20 | 1 | 33 | 31 | 474 | 16.92 | 0 | 22.27 | |||
| GS Chappell (Aus) | 1971-1983 | 74 | 40.18 | 37 | 36 | 1442 | 51.50 | 2 | 37 | 36 | 889 | 29.63 | 1 | 21.87 | |||
| 54 | 1978 | 42.08 | 6 | 57 | 57 | 1192 | 21.28 | 1 | 20.80 | ||||||||
| Yasir Hameed (Pak) | 2003-2007 | 56 | 36.87 | 28 | 28 | 1256 | 46.51 | 2 | 28 | 28 | 772 | 27.57 | 1 | 18.95 | |||
| Basit Ali (Pak) | 1993-1996 | 50 | 34.18 | 25 | 23 | 823 | 43.31 | 1 | 25 | 20 | 442 | 24.55 | 0 | 18.76 | |||
| BA Edgar (NZ) | 1978-1986 | 64 | 30.74 | 32 | 32 | 1092 | 40.44 | 1 | 32 | 32 | 722 | 22.56 | 0 | 17.88 | |||
| VG Kambli (India) | 1991-2000 | 104 | 32.59 | 52 | 48 | 1456 | 41.60 | 1 | 52 | 49 | 1021 | 24.90 | 1 | 16.70 | |||
| MG Bevan (Aus) | 1994-2004 | 232 | 53.58 | 116 | 102 | 3790 | 62.13 | 3 | 116 | 94 | 3122 | 45.91 | 3 | 16.22 | |||
| 86 | 3960 | 55.00 | 8 | 93 | 81 | 2761 | 38.88 | 3 | 16.11 | ||||||||
| Shahriar Nafees (Ban) | 2005-2008 | 60 | 33.76 | 30 | 30 | 1125 | 41.66 | 3 | 30 | 30 | 732 | 26.14 | 1 | 15.52 | |||
| PN Kirsten (SA) | 1991-1994 | 40 | 38.02 | 20 | 20 | 737 | 46.06 | 0 | 20 | 20 | 556 | 30.88 | 0 | 15.17 | |||
| AH Jones (NZ) | 1987-1995 | 87 | 35.69 | 44 | 44 | 1647 | 43.34 | 0 | 43 | 43 | 1137 | 28.42 | 0 | 14.92 | |||
| AL Logie (WI) | 1981-1993 | 158 | 28.95 | 79 | 66 | 1507 | 36.75 | 0 | 79 | 67 | 1302 | 23.25 | 1 | 13.51 | |||
| LPC Silva (SL) | 1999-2010 | 61 | 31.11 | 31 | 27 | 892 | 37.16 | 1 | 30 | 25 | 508 | 24.19 | 0 | 12.98 | |||
| 54 | 1826 | 58.90 | 2 | 73 | 67 | 2461 | 47.32 | 0 | 11.58 | ||||||||
| GA Gooch (Eng) | 1976-1995 | 125 | 36.98 | 63 | 62 | 2505 | 42.45 | 6 | 62 | 60 | 1785 | 31.31 | 2 | 11.14 |
South Africa's AB de Villiers and New Zealand captain Daniel Vettori are two players with significantly superior Test and ODI averages in the second halves of their careers compared to their first halves. De Villiers has already stacked up 61 Tests in six years on the international circuit and his last 30 have been extremely productive, yielding 2311 runs at an average of nearly 60, compared to 1921 at an average of 35 in his first 31 games. His one-day career has followed a similar pattern: he averaged 35 in his first 51 ODIs and 55 in his last 50 games.
Vettori has been among New Zealand's most reliable batsmen in recent years. After 50 Tests he had an average of 20 with only one Test century. He has added four more since then and scored 2713 runs at a mean of nearly 40 in his last 50 matches. As a result of this surge, Vettori's Test average is now 30.71. In ODIs, Vettori had an average of 10 in his first 128 games, which he has improved to 17 by scoring at 23.49 in the second half of his 255-ODI career.
| Player | Span | Mat | Ave | Mat | Inns | Runs | Ave | 100 | Mat | Inns | Runs | Ave | 100 | Diff | |||
|---|---|---|---|---|---|---|---|---|---|---|---|---|---|---|---|---|---|
| SM Gavaskar (India) | 1974-1987 | 108 | 35.13 | 54 | 51 | 1230 | 26.17 | 0 | 54 | 51 | 1862 | 45.41 | 1 | 19.24 | |||
| 50 | 1626 | 35.34 | 2 | 50 | 47 | 1990 | 53.78 | 5 | 18.44 | ||||||||
| JEC Franklin (NZ) | 2001-2010 | 75 | 18.70 | 38 | 22 | 182 | 10.11 | 0 | 37 | 31 | 454 | 28.37 | 0 | 18.26 | |||
| JDP Oram (NZ) | 2001-2010 | 141 | 24.75 | 71 | 54 | 827 | 17.22 | 0 | 70 | 48 | 1376 | 33.56 | 1 | 16.33 | |||
| DS Lehmann (Aus) | 1996-2005 | 117 | 38.96 | 59 | 55 | 1527 | 32.48 | 2 | 58 | 46 | 1551 | 48.46 | 2 | 15.98 | |||
| SR Watson (Aus) | 2002-2010 | 114 | 40.29 | 57 | 41 | 856 | 30.57 | 0 | 57 | 55 | 2126 | 46.21 | 4 | 15.65 | |||
| HH Streak (Afr/Zim) | 1993-2005 | 189 | 28.29 | 95 | 80 | 1020 | 20.40 | 0 | 94 | 79 | 1923 | 35.61 | 0 | 15.21 | |||
| 32 | 391 | 13.03 | 0 | 32 | 31 | 792 | 26.40 | 0 | 13.37 | ||||||||
| TM Dilshan (SL) | 1999-2010 | 188 | 35.73 | 94 | 81 | 1803 | 28.61 | 1 | 94 | 84 | 3057 | 41.87 | 7 | 13.26 | |||
| H Masakadza (Zim) | 2001-2010 | 95 | 28.58 | 48 | 48 | 1020 | 22.17 | 0 | 47 | 47 | 1581 | 35.13 | 3 | 12.96 | |||
| BB McCullum (NZ) | 2002-2010 | 171 | 29.01 | 86 | 67 | 1150 | 21.69 | 0 | 85 | 78 | 2419 | 34.55 | 2 | 12.86 | |||
| DL Vettori (ICC/NZ) | 1997-2010 | 255 | 17.07 | 128 | 80 | 603 | 10.76 | 0 | 127 | 80 | 1292 | 23.49 | 0 | 12.72 | |||
| MS Dhoni (Asia/India) | 2004-2010 | 171 | 50.73 | 86 | 76 | 2535 | 44.47 | 3 | 85 | 76 | 3198 | 57.10 | 4 | 12.63 | |||
| 27 | 729 | 31.69 | 2 | 27 | 26 | 1007 | 43.78 | 0 | 12.09 | ||||||||
| M Amarnath (India) | 1975-1989 | 85 | 30.53 | 43 | 34 | 698 | 24.06 | 0 | 42 | 41 | 1226 | 36.05 | 2 | 11.99 | |||
| CL Hooper (WI) | 1987-2003 | 227 | 35.34 | 114 | 99 | 2173 | 28.97 | 1 | 113 | 107 | 3588 | 40.77 | 6 | 11.80 | |||
| B Zuiderent (Neth) | 1996-2010 | 53 | 25.71 | 27 | 27 | 496 | 20.66 | 0 | 26 | 25 | 584 | 32.44 | 0 | 11.78 | |||
| Yuvraj Singh (Asia/India) | 2000-2010 | 254 | 36.73 | 127 | 114 | 3118 | 30.87 | 4 | 127 | 120 | 4302 | 42.59 | 8 | 11.72 | |||
| OA Shah (Eng) | 2001-2009 | 71 | 30.56 | 36 | 35 | 774 | 24.96 | 1 | 35 | 31 | 1060 | 36.55 | 0 | 11.58 | |||
| 24 | 687 | 31.22 | 1 | 24 | 23 | 892 | 42.47 | 3 | 11.25 |
If there's a particular List you would like to see, email us with your comments and suggestions.
Travis Basevi is a cricket statistician and UK Senior Programmer for Cricinfo and other ESPN sports websites. George Binoy is an Assistant Editor at Cricinfo