Tharanga's ODI exploits
He has the third-best average among Sri Lankan batsmen with 4000 runs, but he can't be considered one of their best just yet
S Rajesh
19-Aug-2011
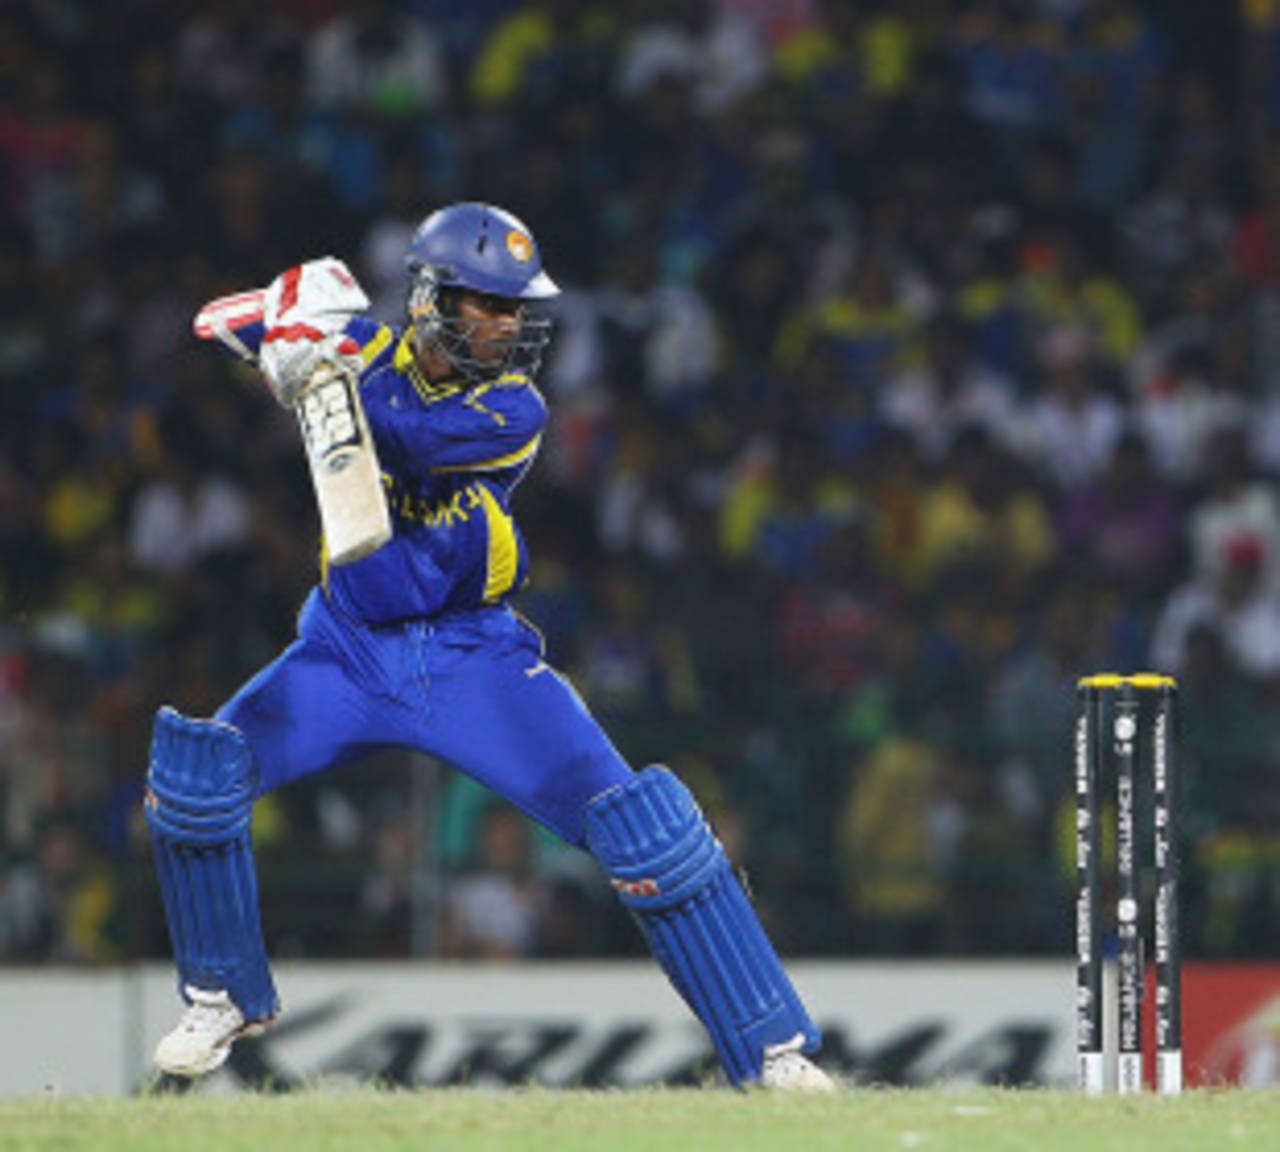
Upul Tharanga has scored 12 ODI hundreds in 114 innings as opener, which is one of the best ratios for innings per century • Getty Images
Talk about the Sri Lankan batting line-up and all the focus over the last few years has been on Sanath Jayasuriya, Mahela Jayawardene, Kumar Sangakkara, and Tillakaratne Dilshan. That has suited Upul Tharanga perfectly, as he has quietly gone about accumulating runs in one-day cricket. A regular Test spot still eludes him, but as an ODI opener he has done pretty well for himself, knocking off more than 4000 runs at a healthy average. His 111 against Australia in Hambantota might not have been his most fluent effort, but it brought Sri Lanka back into the series, and in the process Tharanga became the fastest Sri Lankan to get to 4000 ODI runs, achieving the milestone in four fewer innings than Marvan Atapattu, the previous record-holder.
Admittedly Tharanga doesn't ooze the kind of batting class that Jayawardene and Sangakkara do, and some of his technical deficiencies have been exposed more ruthlessly in Tests, a format in which he has managed only one century - and that against Bangladesh - in 15 matches. However, in the shorter version he has been far more comfortable, especially over the last two and a half years.
In the early part of his career Tharanga did play some important innings, getting a century in Christchurch in January 206, and then two more in England later that year. However, soon after that came a prolonged slump, as he went 52 innings without a century, averaging only 27 over a three-year period. Thankfully for Sri Lanka, Tharanga has regained his form and his ability to score hundreds, getting six in his last 38 innings. Since the beginning of 2009 he has averaged almost 45, which is a huge improvement on his pre-2009 average of 30.91.
| Period | ODIs | Runs | Average | Strike rate | 100s/ 50s |
| Till Dec 2008 | 74 | 2133 | 30.91 | 70.67 | 6/ 9 |
| Jan 2009 onwards | 50 | 1923 | 44.72 | 78.26 | 6/ 10 |
| Career | 124 | 4056 | 36.21 | 74.08 | 12/ 19 |
Tharanga is only the ninth Sri Lankan batsman to get to 4000 ODI runs, and among those players only Sangakkara and Marvan Atapattu have higher averages. At the moment Tharanga has a higher ODI average than Jayawardene, Aravinda de Silva and Jayasuriya - that isn't to say he is a better batsman than them, but he is doing a good job of maximising his potential and making the most of his opportunities.
| Batsman | ODIs | Runs | Average | Strike rate | 100s/ 50s |
| Kumar Sangakkara | 292 | 9243 | 38.03 | 75.52 | 11/ 62 |
| Marvan Atapattu | 268 | 8529 | 37.57 | 67.72 | 11/ 59 |
| Upul Tharanga | 123 | 4046 | 36.45 | 74.19 | 12/ 19 |
| Arjuna Ranatunga | 269 | 7456 | 35.84 | 77.91 | 4/ 49 |
| Tillakaratne Dilshan | 212 | 5587 | 35.36 | 87.41 | 10/ 23 |
| Aravinda de Silva | 308 | 9284 | 34.90 | 81.13 | 11/ 64 |
| Mahela Jayawardene | 345 | 9520 | 32.82 | 77.80 | 14/ 56 |
| Sanath Jayasuriya | 441 | 13,364 | 32.51 | 91.27 | 28/ 68 |
| Roshan Mahanama | 213 | 5162 | 29.49 | 60.59 | 4/ 35 |
One of the best aspects of Tharanga's batting is his ability to convert his starts into big scores. All teams look for batsmen in the top three who have the ability to bat deep into the innings and score reasonably quickly, and Tharanga fits that bill perfectly: of his 31 scores of 50-plus, 12 have been hundreds. He briefly lost that ability during the 52-innings slump mentioned above, but despite that, his overall conversion rate is still among the best. Of the 16 openers who've scored at least 10 centuries at the top of the batting order, Tharanga's conversion rate of 1.58 fifties per century is second-best, next only to Herschelle Gibbs' 1.33.
Sachin Tendulkar's numbers are exceptional, considering he has sustained them over such a long period, but most of the others have less than 20 centuries, and conversion rates of more than two fifties per century.
Tharanga's innings-per-century ratio is excellent too: among these 16 openers, only Tendulkar and Mark Waugh have a better ratio, which means Tharanga has done better in this aspect so far than some big names in ODI batting - Sourav Ganguly (12.42), Chris Gayle (10.84), and Saeed Anwar (11) all have poorer ratios.
| Batsman | Innings | Runs | Average | Strike rate | 100s/ 50s | Inng per 100 | 50s/100s ratio |
| Herschelle Gibbs | 182 | 6103 | 35.69 | 82.86 | 18/ 24 | 10.11 | 1.33 |
| Upul Tharanga | 114 | 3993 | 36.97 | 74.17 | 12/ 19 | 9.50 | 1.58 |
| Sachin Tendulkar | 330 | 14,995 | 48.84 | 88.20 | 44/ 74 | 7.50 | 1.68 |
| Marcus Trescothick | 122 | 4335 | 37.37 | 85.21 | 12/ 21 | 10.17 | 1.75 |
| Saeed Anwar | 220 | 8156 | 39.98 | 79.93 | 20/ 37 | 11.00 | 1.85 |
| Mark Waugh | 141 | 5729 | 44.06 | 76.74 | 15/ 32 | 9.40 | 2.13 |
| Chris Gayle | 206 | 7839 | 41.04 | 84.62 | 19/ 42 | 10.84 | 2.21 |
| Sanath Jayasuriya | 383 | 12,740 | 34.61 | 92.49 | 28/ 66 | 13.68 | 2.36 |
| Virender Sehwag | 197 | 7005 | 36.67 | 104.45 | 13/ 34 | 15.15 | 2.62 |
| Nathan Astle | 186 | 6176 | 34.89 | 72.72 | 14/ 37 | 13.29 | 2.64 |
A less flattering aspect of Tharanga's batting, though, is his tendency to get out early in his innings very often. Thirty times he has been dismissed for single-digit scores, which is a quarter of his total innings. Ten of those dismissals were for ducks, which works out to an average of one duck every 11.40 innings. When compared to some of the other top openers, this rate is among the poorest: Tendulkar averages 27.50 innings per zero, Ganguly 18.15, Matthew Hayden 21, Anwar 15.71, Waugh 15.67, and Jayasuriya 13.21.
Tharanga also has 41 innings (including two not-outs) between 10 and 29, which means 71 of his 119 ODI innings haven't topped 30. Once he touches 30, though, his chances of getting a century go up to 25%.
| < 10 | 10 to 29 | 30 to 49 | 50 to 99 | 100 and above | |
| No. of innings | 30 | 41 | 17 | 19 | 12 |
Tharanga's opening combination with Dilshan is on its way to becoming Sri Lanka's best. They've already put together the third-highest number of partnership runs, but at a much higher average than the earlier opening combinations. Atapattu and Jayasuriya tallied 3382 partnership runs for the first wicket, which remains Sri Lanka's highest, but their average stand of 43.92 is well short of the Tharanga-Dilshan average of 64.16.
| Pair | Innings | Runs | Ave stand | Run rate | 100/ 50 stands |
| Dilshan-Tharanga | 37 | 2310 | 64.16 | 6.01 | 8/ 9 |
| Atapattu-Jayasuriya | 79 | 3382 | 43.92 | 5.05* | 8/ 19 |
| Jayasuriya-Tharanga | 52 | 2021 | 38.86 | 5.78* | 4/ 8 |
| Gunawardene-Jayasuriya | 44 | 1374 | 31.95 | 4.95* | 1/ 9 |
| Jayasuriya-Kaluwitharana | 105 | 3230 | 31.05 | 5.24* | 6/ 19 |
Despite all the runs and hundreds Tharanga has scored, though, he remains a few rungs below Sri Lanka's top names in ODIs. Apart from the fact that he needs to sustain this run over a longer period of time, what he also needs to do to enter the big league is score more runs against the better teams, and on the big stages. At the moment Tharanga's numbers are a bit lopsided: in seven tournament finals he averages 14.85, while his average against the lesser sides is about one and a half times his average against the seven better teams. Against those seven sides he averages a century every 13 innings; against the poorer sides, he gets one every six. The hundred against Australia in Hambantota was a step in the right direction; Tharanga now needs to ensure these big knocks against the best sides happen more often.
| Against | ODIs | Runs | Average | Strike rate | 100s/ 50s |
| Top 7 teams | 92 | 2703 | 32.56 | 71.62 | 7/ 12 |
| The rest | 31 | 1343 | 47.96 | 79.98 | 5/ 7 |
S Rajesh is stats editor of Cricinfo